Debugging AEM Web Stacks Properly
Tools and approaches to finding the root cause of performance issues analytically and debugging AEM Web Stacks properly.

With web stacks getting larger and more complex, the need for debugging is more present then ever. Performance issues are especially painful to debug, and require much time and attention until a root cause analysis is completely performed. It is sometimes difficult to understand how to debug a problem or where to start when working on AEM Web Stacks. This blog article builds on some of the tools and approaches already mentioned on Analysing Issues Properly in AEM.
A common topic in AEM setup is that there are performance issues or bugs, and someone needs to find the root cause. In many cases the DevOps team or systems engineer tends to have the broadest understanding of the whole web stack, and in the end starts a first analysis.
Usually one can categorise the different types of issues into two specific categories:
- Performance, something is running slow, the request isn't answered properly or similar
- Some bug, something isn't working as expected, a header is present but should not be
In an AEM stack there are multiple layers involved:
CDN
For debugging such a large stack, it is possible to start on one end or the other. In most cases with AEM, it is good to start at AEM level and then work your way out because in many cases a bug, for example with a request , may be already at AEM level OR in fact it lets you know right away it is not at the AEM level.
Below is a high level representation of a valid approach which can be applied to debug such a complex web stack for performance or bug type scenarios.
Performance
For performance issues, one can use various tools to first get an overview of where exactly the performance issue is coming from:
- Leverage the rlog.jar to identify slow running requests.
- Use the graphing tool from Jörg Hoh to visualize them.
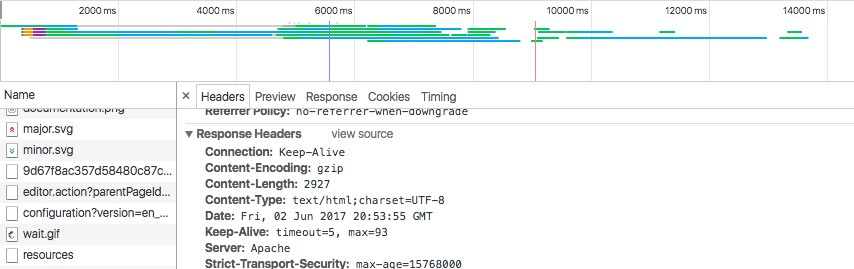
- A good start is also to use your browser development tools. In some cases, this can lead to a quick pointer in the direction.
Additionally it makes sense to look at performance data from the instance itself and not AEM only. For this, nmon is simple but very effective.
Use nmon logs + nmon visualizer to visualise performance issues on the server
- Gather all the logs (error, request, nmon etc.)
- Create threaddumps before you restart AEM every 5 seconds 10 pieces
- Create the rlog jar output
- Visualize the logs
- Pinpoint a specific time when the issue occurred.
- Try to correlate slow running requests to some potential issues seen in nmon
- If you can't, the chances are high that the issue is in AEM. This will give you a good guess if it is an AEM issue or possibly some other problem impacting AEM
- A first step is to find the request and look in the error.log to see if there is any stacktrace possibly popping up in relation to the long-running request
- If it is an AEM issue, thread dumps are a must-have.
To analyze thread dumps you can use fastThread or Online Java Thread Dump Analyzer
At this point when looking at thread dumps it is good to involve the solutions architect or a senior developer to further analyze them if you are missing the detailed knowledge.
Additionally, many projects have profilers at hand. For example, AppDynamics. Use it! Look at the general metrics, look for correlations and look at the garbage collections or other JVM metrics to try to identify a possible request and or job.

Bugs
Begin finding bugs by reproducing the problem. Start by getting exact input if you can. Try re-producing the problem in your test environment with as little data as possible. Ask about all the conditions present when the problem occurred (for example, other users, batch jobs, etc.)
In some cases, you may need to debug some requests. The first stop is the browser dev tools. Here, ensure you are able to extract the specific request you need. You can alter it with a cache killer to see if it is an issue with the cache.
Debugging bugs with proper domains
In other cases, use DNS spoofing to setup local/etc/hosts entries set to a specific IP to simulate a public DNS record, but test directly against an AEM for example. Alternatively, a local proxy can help or tunnelling yourself to the server if direct access is not possible.
Work your way back from the CDN down to AEM to debug those issues. Either way, it is doable.
Debugging headers
Adobe has the so called proxy.jar which is very helpful in these cases. This can be used to debug headers as it logs out the complete request output.
Problems after deployment
Generally use health checks to check if an instance is in a good state after deployment. Additionally, you might want to check the following things manually:
- Are all packages installed and in installed state
- Are all bundles present
- Are all bundles that should be present, in the right version
- Ensure the cache was flushed or invalidated
Comparing bundles
Additionally, you can use OOB OSGI Sanity Check to check the bundles or OOB OSGI Sanity Check Between Environments to compare the bundles between two instances.
Conclusion
The approach to finding root causes of performance issues or bugs should always be an analytical one. This can save much time and allows for achieving faster results. Don't spend too much time in areas you are not sure about. Instead, involve a solutions architect or developer especially if the issue seems to be coming from within AEM. Robelle has published a very interesting article on their site on how to debug such issues. It is a recommended read even if not all points are fully applicable. The article elaborates on the clear analytical approach needed to solve performance issues and bugs quickly.